Last Updated: August 21, 2026
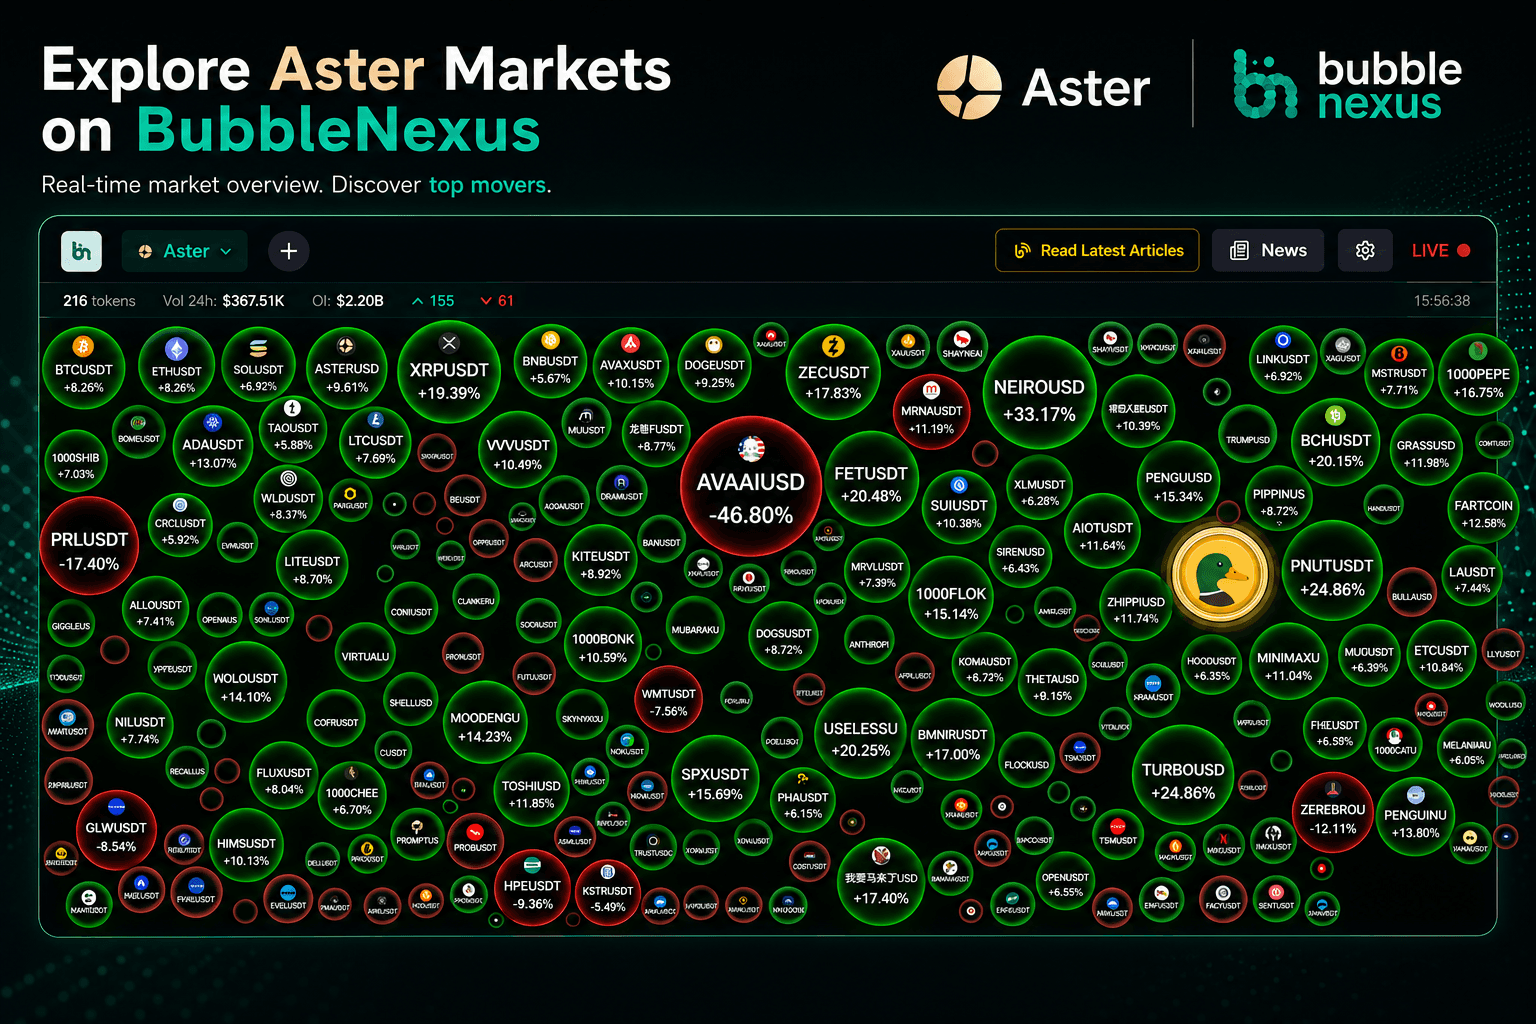
Navigating decentralized perpetual futures requires more than just glancing at spot prices. Traders need real-time visibility into open interest, funding rates, liquidity flows, and cross-sector momentum. The Aster page on BubbleNexus serves as an advanced crypto bubble alternative, combining dynamic visual mapping with institutional-grade perpetual data across 216 tracked tokens.
What makes Aster on BubbleNexus an essential tool for perpetual traders?
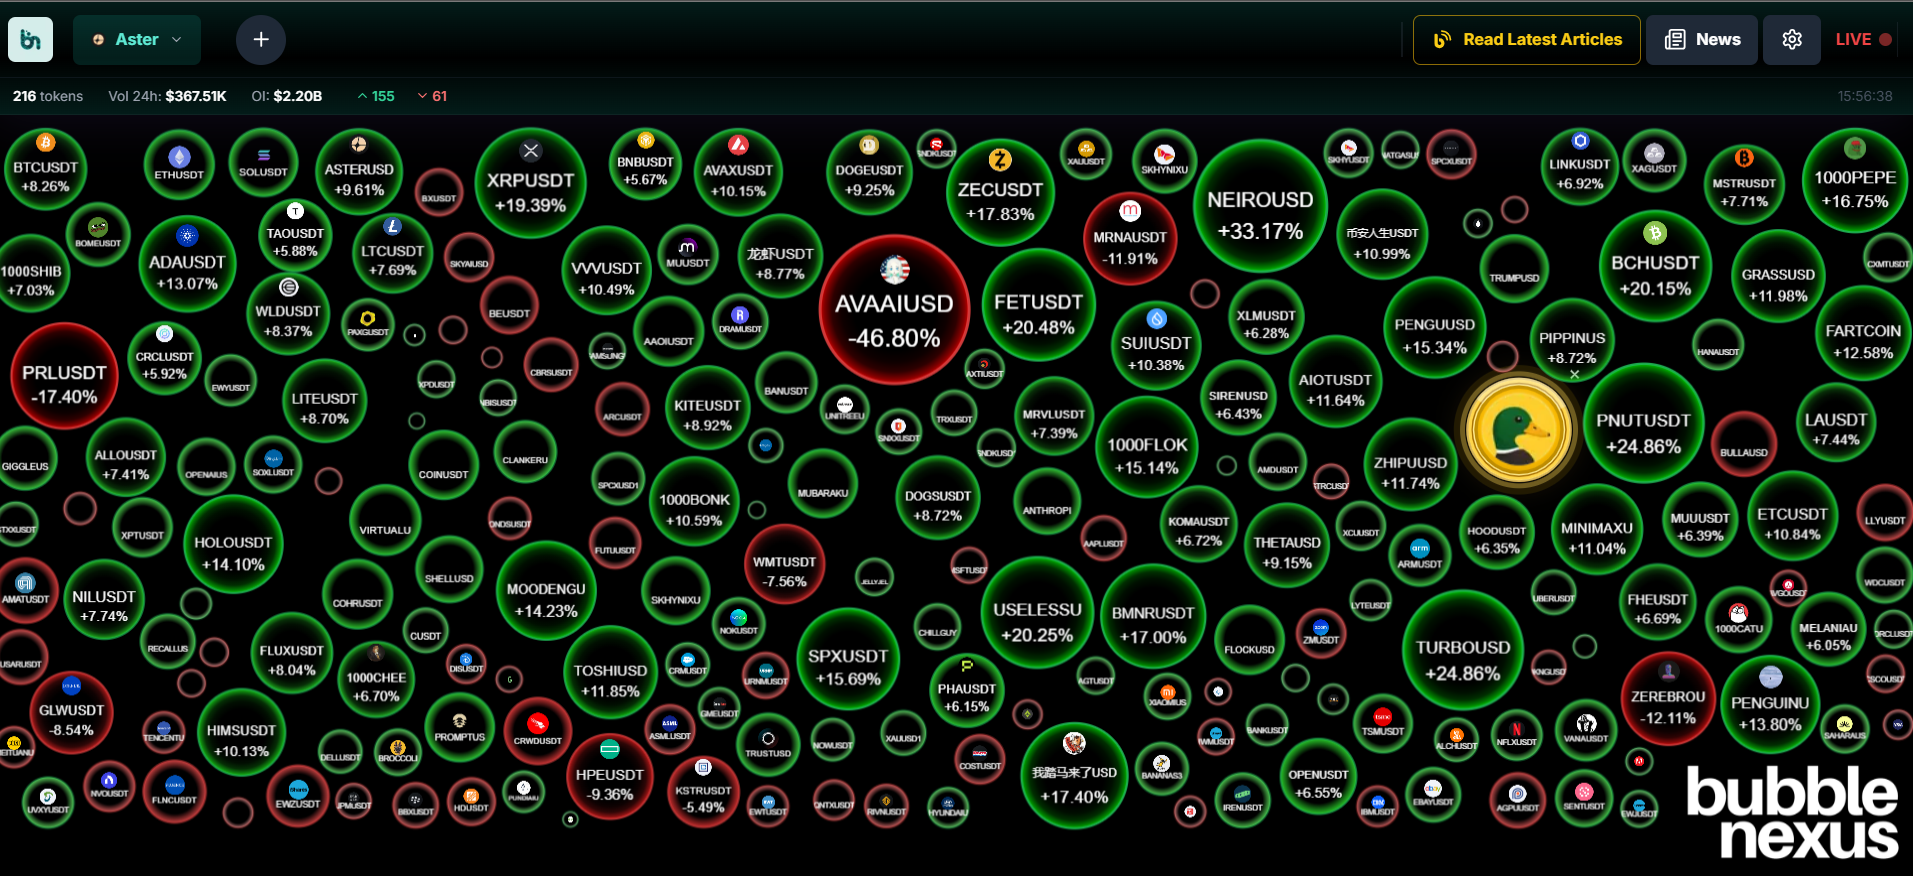
Aster bridges the gap between high-speed visual sentiment analysis and deep derivatives data, allowing traders to monitor 216 perpetual contracts with live open interest exceeding $2.20 billion.
- Comprehensive Asset Coverage: Tracks exactly 216 tokens spanning crypto-native sectors, decentralized perpetual pairs, and traditional financial assets.
- Live Market Breadth: Instantly displays active market sentiment, capturing gainers and losers in real-time sessions.
- Derivatives Liquidity: Aggregates crucial perpetual metrics including total open interest, 24-hour trading volume, and 8-hour funding rates.
How do I use category filters and bubble sizing metrics to analyze market momentum?
Traders can customize their view by switching between multi-sector categories (All, Top, AI, Meme, ETF, Semiconductor, Commodities, and Stock) and adjusting bubble sizing to reflect Price, Open Interest (OI), Volume (Vol), Funding (Fund), or 24h percentage change.
Click on the "Plus icon" to explore control menu
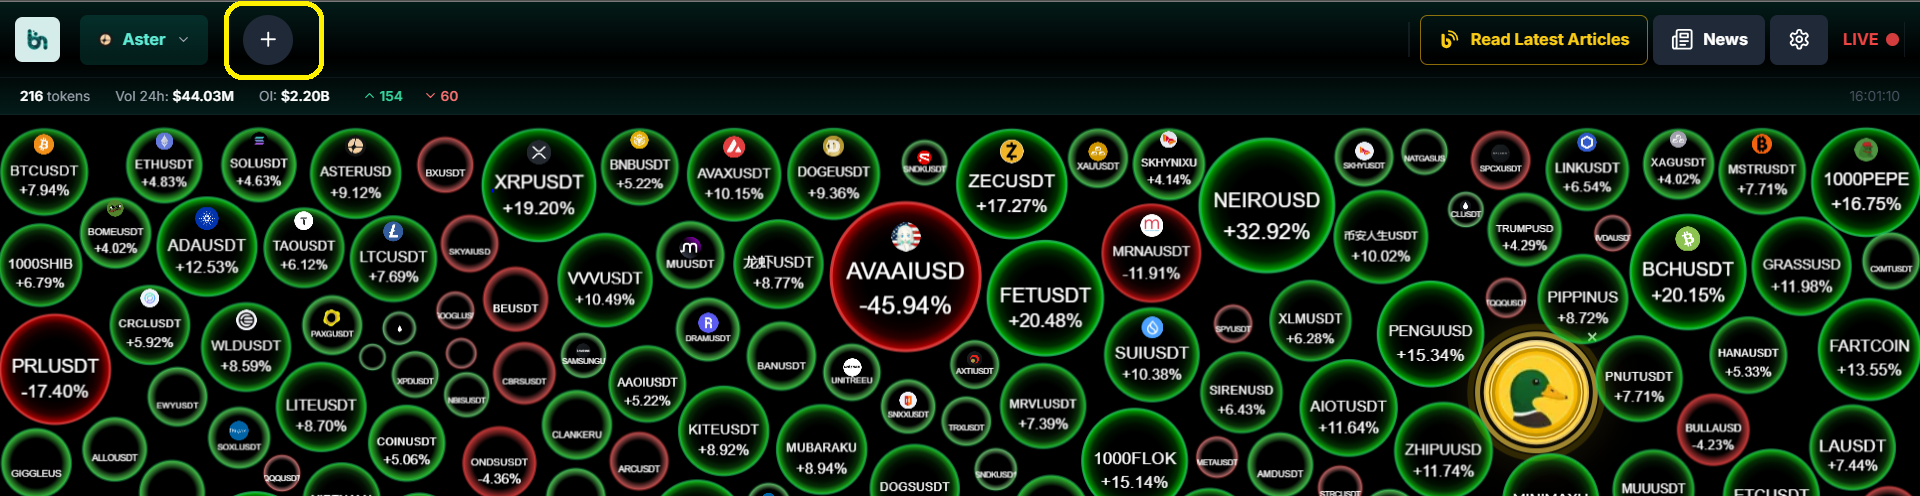
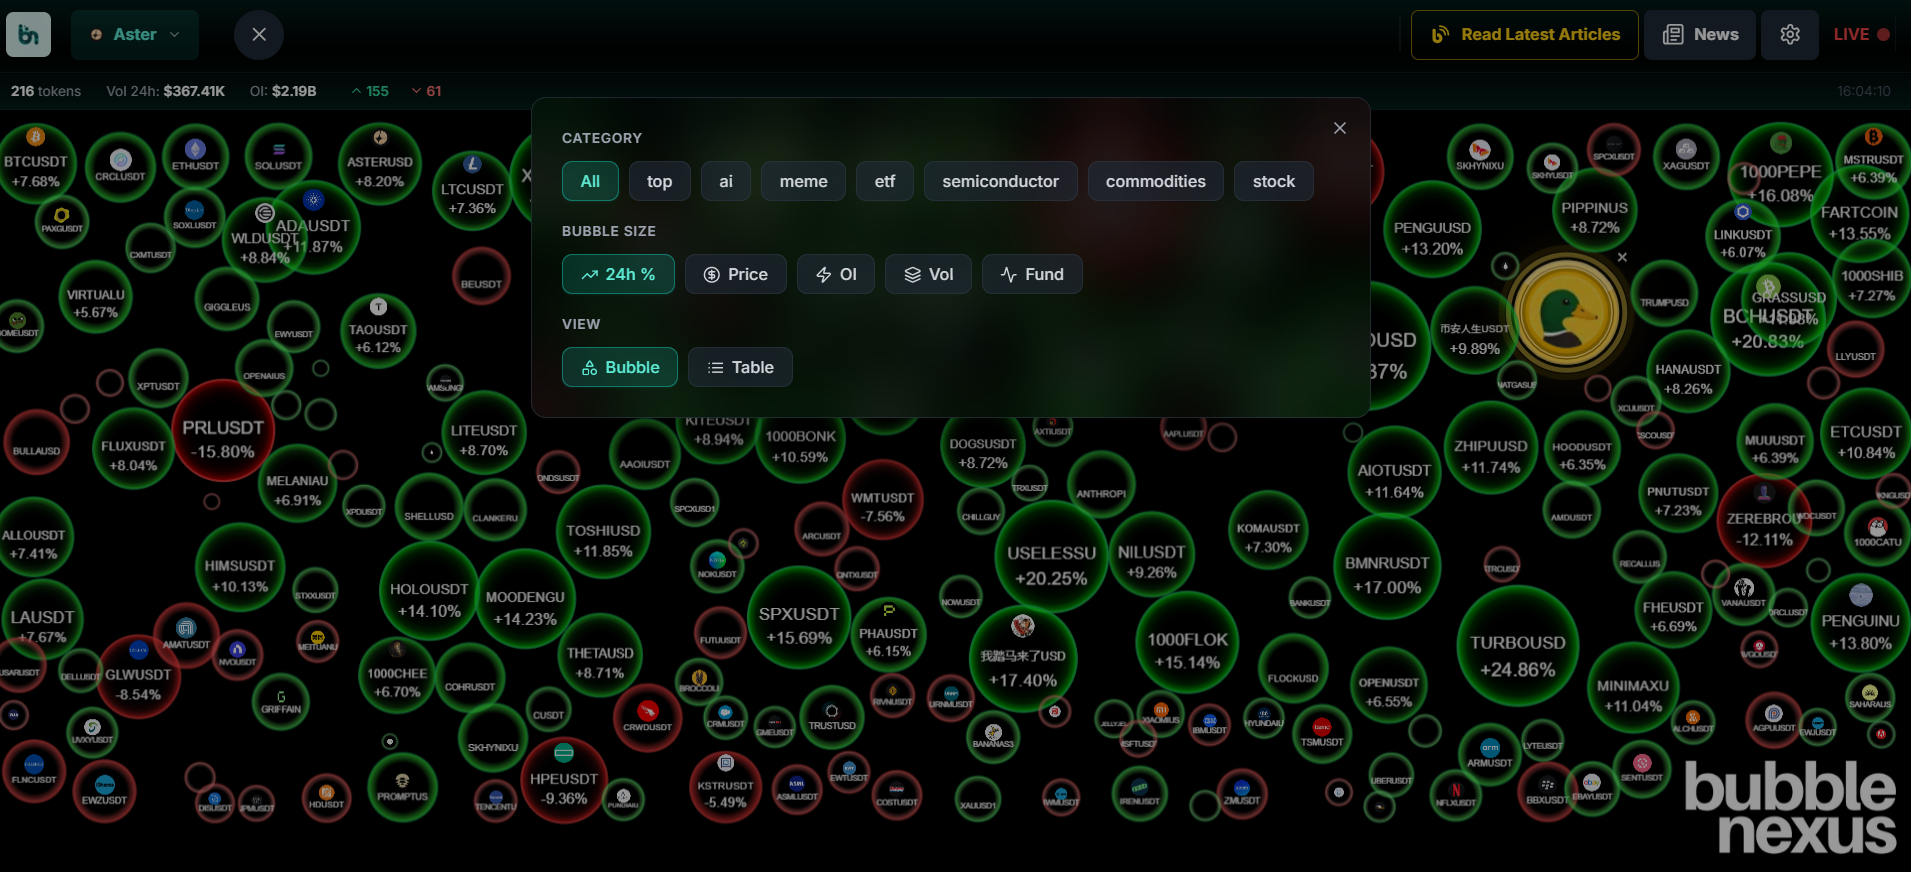
Understanding what each bubble size metric represents is critical for executing an effective trading strategy:
- 24h % (Percentage Change): Sizing bubbles by percentage move highlights immediate volatility spikes, making extreme gainers and losers stand out instantly.
- Price: Scales bubbles based on nominal asset price, grouping high-value assets apart from fractional or micro-priced tokens.
- Open Interest (OI): Sizing by OI reveals where market capital and leveraged positions are heaviest, showing which tokens hold the most systemic interest.
- Volume (Vol): Highlights active liquidity and trading turnover, helping traders separate high-volume leaders from stagnant markets.
- Funding (Fund): Visualizes 8-hour funding rate pressures, signaling potential long or short overcrowding and impending liquidations.
How should I analyze Bubble View and Table View separately?
Bubble View is optimized for macro sentiment and pattern recognition, whereas Table View provides precision numerical filtering for granular risk assessment and side-by-side comparison.
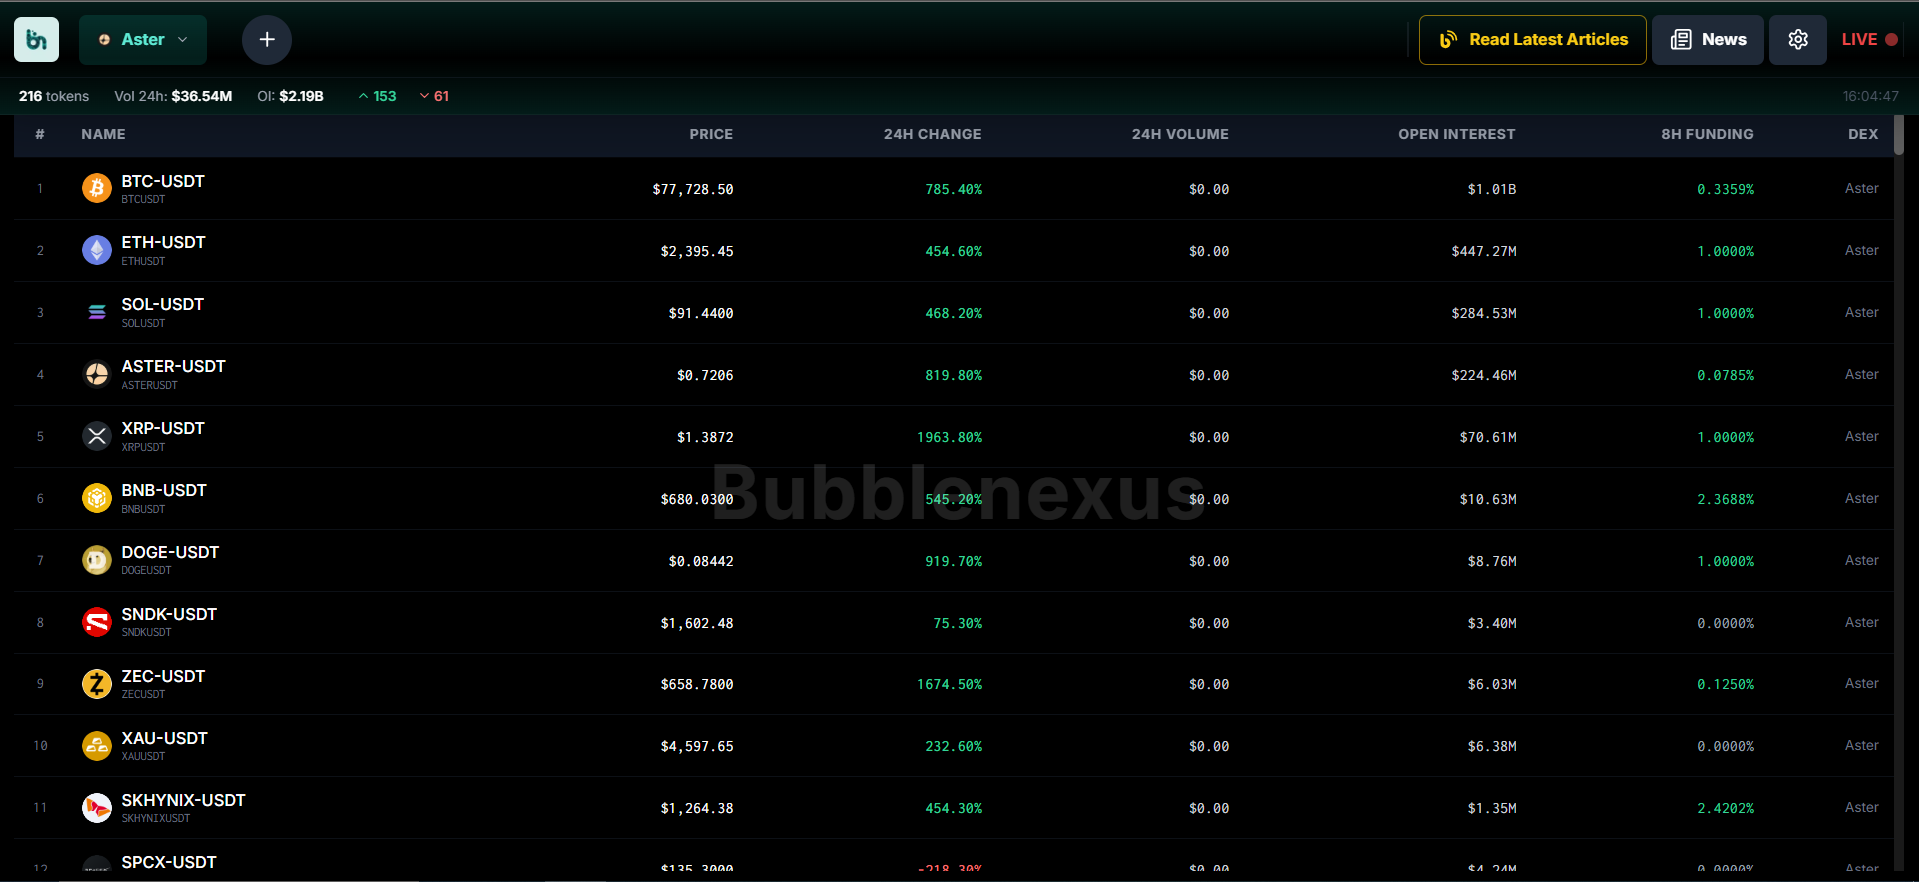
Analyzing Bubble View (Visual Sentiment)
In Bubble View, every asset is represented as a circular node. Color coding immediately establishes direction: green for gains and red for losses, with color saturation reflecting the intensity of the move. When analyzing this view:
- Scan for cluster behavior: Are all AI tokens turning green simultaneously? This indicates sector-wide capital rotation.
- Check relative sizing: If a token has a massive bubble size set to Open Interest, it commands heavy leverage regardless of its percentage gain.
Analyzing Table View (Tabular Precision)
When you require exact figures, switching to Table View organizes all 216 tokens into structured rows. Traders use this view to:
- Sort columns by 8-hour funding rates to spot extreme positive or negative funding anomalies.
- Compare open interest directly against 24-hour volume to evaluate capital efficiency and leverage ratios.
How does clicking an individual token reveal deeper contract insights?
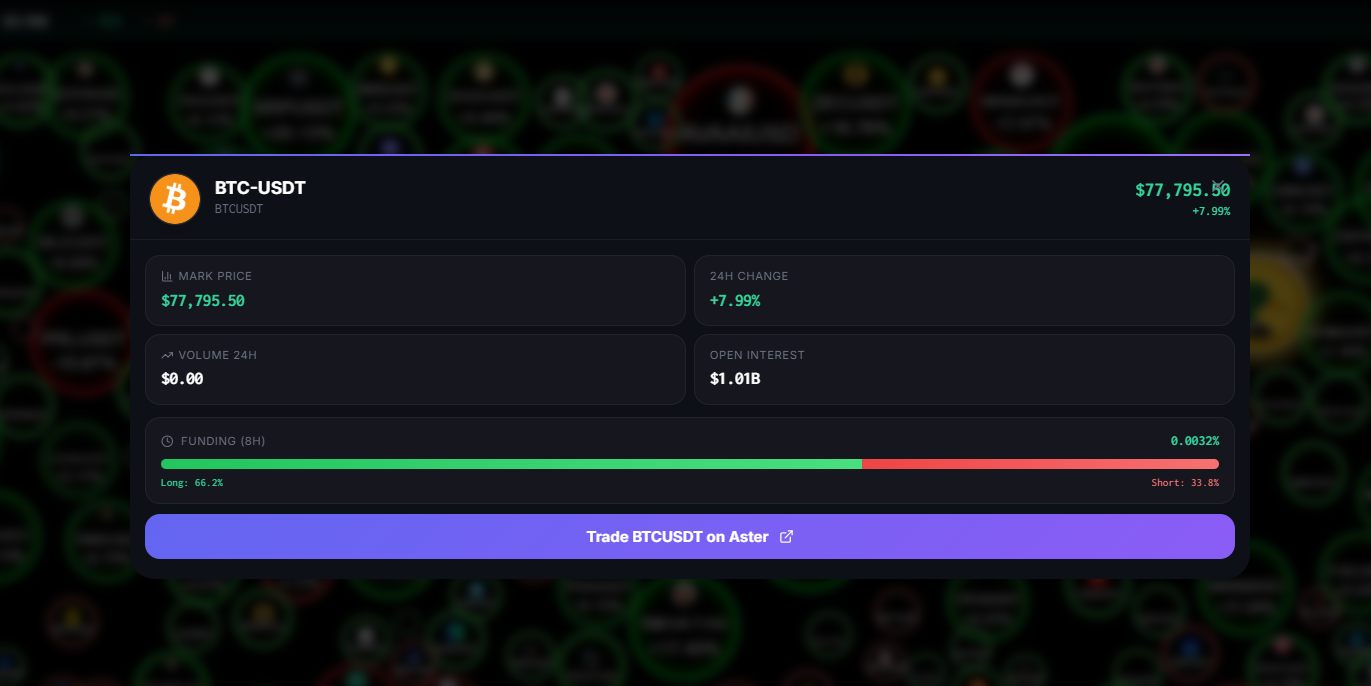
Clicking any token bubble opens an interactive modal displaying real-time mark prices, exact long/short ratios, 24-hour volume, open interest, and direct trade execution links.
How does Aster on BubbleNexus compare to traditional crypto analysis methods?
Traditional crypto trackers rely on static spreadsheet tables that require manual scrolling, whereas Aster integrates visual asset grouping, derivatives data, and multi-sector filtering into a unified interface.
| Analytical Feature | Traditional Spreadsheets / Tables | BubbleNexus Aster Dashboard |
|---|---|---|
| Information Processing Speed | Slow; requires scanning rows of numbers manually. | Instant; human eye processes color and scale within seconds. |
| Derivatives Integration | Often limited to basic spot volume and market cap. | Deep integration of Open Interest, Funding Rates, and Long/Short ratios. |
| Asset Scope | Restricted to standard spot cryptocurrencies. | Includes perpetual contracts, equities, ETFs, semiconductors, and commodities. |
| Customization & Sizing | Fixed sorting parameters (alphabetical or market cap rank). | Dynamic bubble sizing driven by Price, OI, Volume, Funding, or 24h%. |
Frequently Asked Questions (FAQs)
Q: What does the Aster page on BubbleNexus track?
A: It tracks 216 decentralized perpetual futures tokens, providing live feeds for prices, open interest, funding rates, and multi-sector categories.
Q: How do I change what the bubble size represents?
A: You can open the control menu and select between 24h percentage change, Price, Open Interest (OI), Volume (Vol), or Funding Rate (Fund).
Q: What is the difference between Bubble View and Table View?
A: Bubble View visualizes market sentiment through color-coded, scaled spheres for rapid scanning, while Table View organizes all assets into a sortable, numerical list.
Q: Can I view traditional stock and commodity markets on Aster?
A: Yes, the platform features specialized category filters for stocks, ETFs, semiconductors, and commodities alongside crypto sectors.
Q: Is BubbleNexus free to use?
A: Yes, BubbleNexus provides all real-time visual maps and data tables completely free with no registration required.
Disclaimer: This content is for informational purposes only, not financial advice. Crypto investments carry risk, including possible loss of funds. Do your own research before investing.