



A Hyperliquid liquidation map shows the price levels where many leveraged trades could be closed by force. Traders use it to see where risk is building up before the price gets there.
If you have ever seen a coin drop or jump very fast, a liquidation cascade is often part of the reason. A liquidation heatmap helps you spot these zones early. In this guide, you will learn what a liquidation map is, how to read it step by step, and how to use it in a safe way.
What Is a Hyperliquid Liquidation Map?
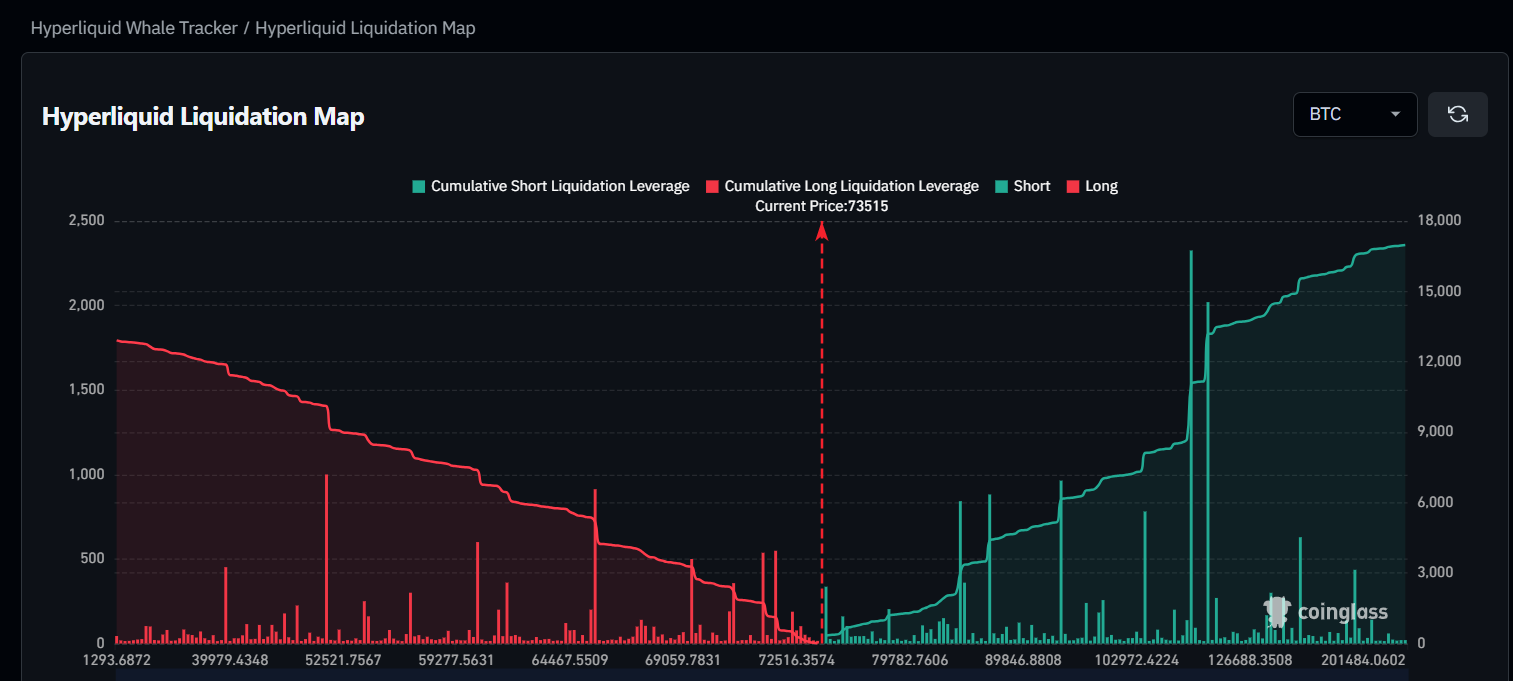
A liquidation map is a chart. It shows the prices where leveraged positions would be liquidated. Each price level has a bar or a color. The bigger or brighter it is, the more positions would be closed there.
Hyperliquid is a decentralized exchange for perpetual futures. Because traders can use leverage on it, liquidations happen every day. A Hyperliquid liquidation map puts these risk zones on one screen so you do not have to guess.
Some people say "liquidation map" and some say "liquidation heat map". They mean the same thing in most cases.
What Is a Liquidation Heatmap in Crypto Trading?
A liquidation heatmap is a liquidation map that uses colors. Dark colors mean few positions. Bright colors mean many positions. It is called a heatmap because the "hot" zones are where the most trades are at risk.
Liquidation Price and Leverage Explained
Leverage lets you open a bigger trade with less money. For example, if you put in $1,000 and use 10x leverage, you control a $10,000 position. This also means a price move of a bit less than 10% against you can wipe out your money.
The price where this happens is your liquidation price. The higher the leverage, the closer your liquidation price is to the entry price.
Long Liquidations vs Short Liquidations
- Long liquidation: You bet the price will go up, but it goes down. If it falls to your liquidation price, you are liquidated.
- Short liquidation: You bet the price will go down, but it goes up. If it rises to your liquidation price, you are liquidated.
On a heatmap, long liquidation zones sit below the current price. Short liquidation zones sit above it.
To learn what else affects your costs on Hyperliquid, read guide on Hyperliquid fees.
How Does a Liquidation Heatmap Work?
A liquidation heatmap collects data about open positions and their leverage. Then it works out the price where each position would be closed. All these prices are added together and drawn as colors on a chart.
Where Liquidation Data Comes From
On many exchanges, the exact positions are private, so tools have to make estimates. Hyperliquid is different because position data is public on the blockchain. This means some tools can build maps from real positions instead of only guesses.
Why Price Often Moves Toward Liquidation Clusters
When many traders are liquidated at the same price, their positions are closed with market orders. This adds extra buying or selling pressure. That is why price sometimes moves fast when it reaches a big cluster. It does not happen every time, but it happens often enough to watch.
How Liquidation Works on Hyperliquid
Hyperliquid closes a position when the money backing it falls below the maintenance margin. This is the smallest amount of margin you must keep to hold the trade. When your account falls under it, the position is closed to stop more losses.
Isolated Margin vs Cross Margin
- Isolated margin: Only the money you put into that one trade is at risk.
- Cross margin: Your whole account balance supports your open trades, so one bad trade can affect the others.
Maintenance Margin and Partial Liquidation
Rules can change by market and position size. For large positions, only a part of the trade may be closed first. For the exact numbers, always check the official Hyperliquid docs.
How to Read a Liquidation Heatmap Step by Step
Do not worry if the chart looks confusing at first. Follow these steps.
Step 1: Read the Price Axis and Time Axis
The price is usually on the side and the time is at the bottom. Find the current price line first. Everything above it is a possible short liquidation zone. Everything below it is a possible long liquidation zone.
Step 2: Understand Bright and Dark Zones
Bright zones mean many positions would be liquidated there. Dark zones mean few. Brighter does not mean the price will go there. It only shows where more risk is sitting.
Step 3: Find Long and Short Clusters
Look for thick bands of bright color. These are clusters. If the bigger cluster is above the price, short traders are more at risk. If it is below, long traders are more at risk.
Liquidation Heatmap vs Liquidity Heatmap: What Is the Difference?
These two names sound alike, but they show different things. Many beginners mix them up.
Liquidation Heatmap
It shows where leveraged trades would be forced to close. It is about risk.
Order Book (Liquidity) Heatmap
It shows where buy and sell orders are waiting in the order book. It is about orders that have not been filled yet.
Stop Loss and Take Profit Heatmaps
These show where traders have placed their stop loss and take profit orders. Many orders can trigger at the same price, so price often reacts around these zones.
| Heatmap type | What it shows | Best used for |
|---|---|---|
| Liquidation heatmap | Prices where leveraged trades are closed by force | Finding risk zones |
| Order book (liquidity) heatmap | Where buy and sell orders are waiting | Finding support and resistance |
| Stop loss / take profit heatmap | Where exit orders are placed | Seeing where price may react |
| Market heatmap (Bubblenexus) | Which markets are rising or falling based on their 24-hour price percentage change | Comparing which markets are up or down over the last 24 hours |
How to Read the Hyperliquid Order Book
Hyperliquid uses an on-chain order book. It is a list of all open buy and sell orders. Reading it helps you understand how easy it is to buy or sell without moving the price.
Bids, Asks and Spread
- Bids: Buy orders. They are shown below the current price.
- Asks: Sell orders. They are shown above the current price.
- Spread: The gap between the best bid and the best ask. A small spread means the market is liquid.
Reading Resting Liquidity on an Order Book Heatmap
An order book heatmap colors the price levels by order size. Bright levels have big orders waiting. These levels can act like a wall, and price may slow down or bounce there. Big orders can also be removed in a second, so do not trust them fully.
The order book shows bids, asks and the spread.
Hyperliquid (HYPE) Liquidation Heatmap: Where to Check Live Data
HYPE is the token of the Hyperliquid network. Its market can move fast, so many traders watch it closely. For live data, you can use two steps:
- Open the Bubblenexus Hyperliquid to to check the 24-hour price percentage change of HYPE and other markets.
- Open a liquidation heatmap tool to check the liquidation levels for the same market.
How to Use a Liquidation Heatmap in Trading
Find Support and Resistance Zones
Big clusters can act like magnets. Price may move toward them, or it may stall near them. Mark these levels on your chart.
Spot Possible Liquidation Cascades and Squeezes
If price is close to a big cluster, a fast move can start a chain reaction. One liquidation pushes the price, and that pushes the next one. Watch the market heatmap for sudden red or green bubbles at the same time.
Plan Safer Stop Losses and Position Sizes
Do not put your stop loss exactly where everyone else does. Big clusters are crowded. Think about using lower leverage so that your liquidation price is far from these zones.
Liquidation Heatmap and Risk Zone Analysis: A Simple Example
Here is a made-up example to show the idea. The numbers are not real.
- A coin trades at $100. The heatmap shows a bright cluster at $95 and another one at $108.
- The cluster at $95 means many long traders would be liquidated if the price falls there.
- The cluster at $108 means many short traders would be liquidated if the price rises there.
- You open the heatmap and see the coin is up 6% in one hour. The price is moving toward $108.
- You now know a short squeeze is possible. You keep your leverage low and do not chase the move.
This is how the two tools work together. The market heatmap tells you what is moving. The liquidation map tells you where the risk is.
Common Mistakes When Reading Liquidation Maps
Treating Estimated Data as Exact
A map is an estimate. Traders can add margin or close a trade at any time, so the picture can change in minutes.
Ignoring Funding, Volume and News
A liquidation map is only one piece of the puzzle. Always check volume, funding rates and news too. You can read about the news around the exchange in HIP-3 upgrade guide.
Using More Leverage Because of a Signal
A bright cluster is not a reason to open a bigger trade. It is a reason to be more careful.
Best Liquidation Heatmap Tools for Hyperliquid Traders
No single tool shows everything. Here is a simple way to compare them.
| Tool | What it is good for |
|---|---|
| Coinglass | Liquidation and derivatives data, including Hyperliquid |
| Datawallet | A Hyperliquid liquidation heatmap page |
| Bookmap | Order book heatmaps and deep order flow analysis |
Features and prices change often, so check each website before you use it.
Bubblenexus also has free crypto widgets if you want to show live market data on your own website.
Hyperliquid vs Other Perp DEXs: Heatmap and Data Differences
Hyperliquid is not the only place to trade perpetual futures on-chain. Each exchange has its own markets, fees and traders, so the heatmaps look different too. You can compare them on:
If you want to compare Hyperliquid with another protocol, read Variational vs Hyperliquid.
Conclusion: Key Takeaways
- A Hyperliquid liquidation map shows where leveraged trades could be closed by force.
- Bright zones mean more risk, not a sure price move.
- Long zones are below the price and short zones are above it.
- A liquidation map and an order book heatmap are not the same thing.
- Keep your leverage low and never trade with money you cannot lose.
This article is for information only and is not financial advice. Crypto trading with leverage is risky. Always do your own research.
Frequently Asked Questions
What is a liquidation map in crypto?
A liquidation map is a chart that shows the price levels where many leveraged trades would be closed by force. It helps traders see where a lot of long or short positions could be wiped out.
How do you read a liquidation heatmap?
Look at the price axis first. Brighter colors mean more positions would be liquidated near that price. Clusters below the current price are mostly long positions, and clusters above are mostly short positions.
What is the difference between a liquidation heatmap and a liquidity heatmap?
A liquidation heatmap shows where leveraged trades could be forced to close. A liquidity heatmap, also called an order book heatmap, shows where buy and sell orders are waiting in the order book.
How does liquidation work on Hyperliquid?
A position is liquidated when the money backing it falls below the maintenance margin. Hyperliquid then closes the position to stop further losses. The exact rules depend on the market and margin mode, so check the official Hyperliquid docs.
Is there an official Hyperliquid liquidation map?
Hyperliquid shows the order book and your own liquidation price on its trading screen. Liquidation heatmaps for the whole market are usually built by third-party data tools.
Are liquidation heatmaps accurate?
They are estimates. Traders can add margin, change leverage or close a trade at any time, so the map can change quickly.
Can a liquidation heatmap predict price moves?
No. It shows where risk is built up, not where price will go. Use it as one tool along with price action, volume and news.
What does liquidation price mean in crypto?
Liquidation price is the price at which your leveraged position is closed by force because your margin is too low to keep it open.
What are stop loss and take profit heatmaps?
They show where traders have placed stop loss and take profit orders. Price often reacts around these zones because many orders can trigger at once.
What is the best free liquidation heatmap tool?
It depends on what you need. Some tools show liquidation levels, while Bubblenexus shows which Hyperliquid markets are moving right now. Many traders use both.