



This article is for general information, not investment advice. Bitcoin is volatile, and investors can lose some or all of their money.
Bitcoin in 2026: the short version
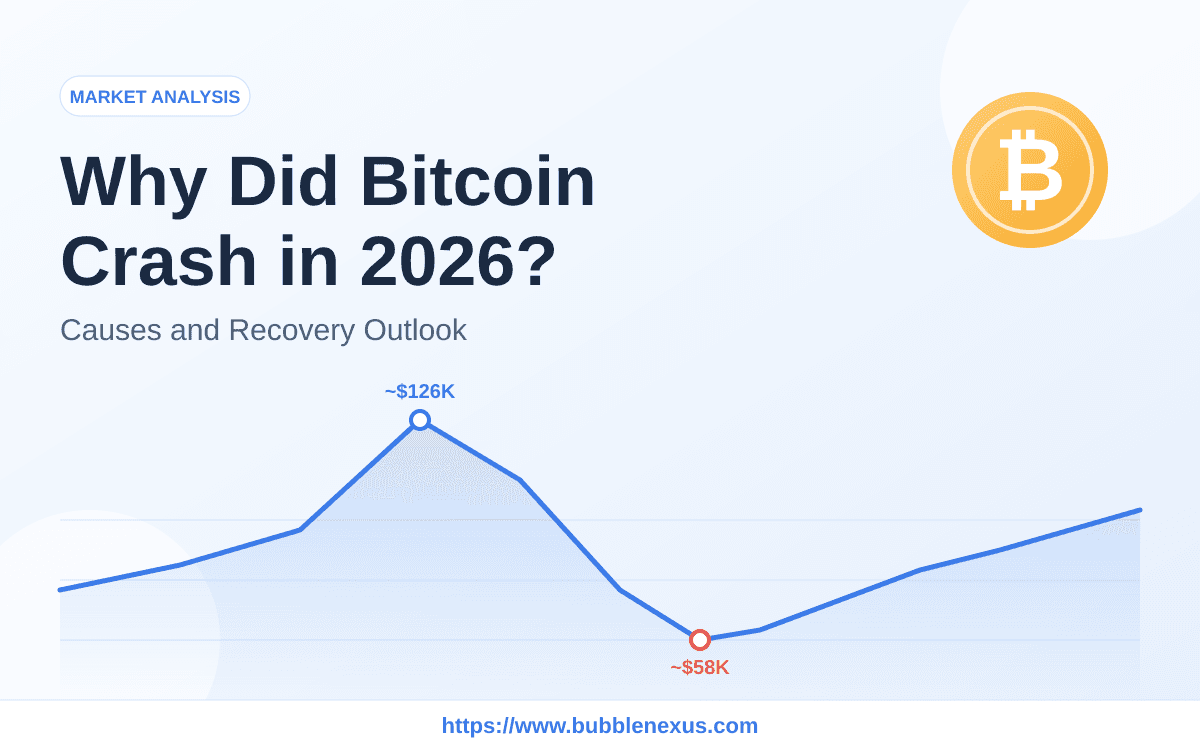
Bitcoin reached a record near $126,000 in October 2025. It then fell into the $58,000 area around the turn of June and July 2026 before climbing back above $80,000 by late October.Historical data platforms record a daily low of $58,075.92 on June 25 and $57,747.76 on July 1. The dates and exact prices vary by source because each exchange and price index records its own trades.
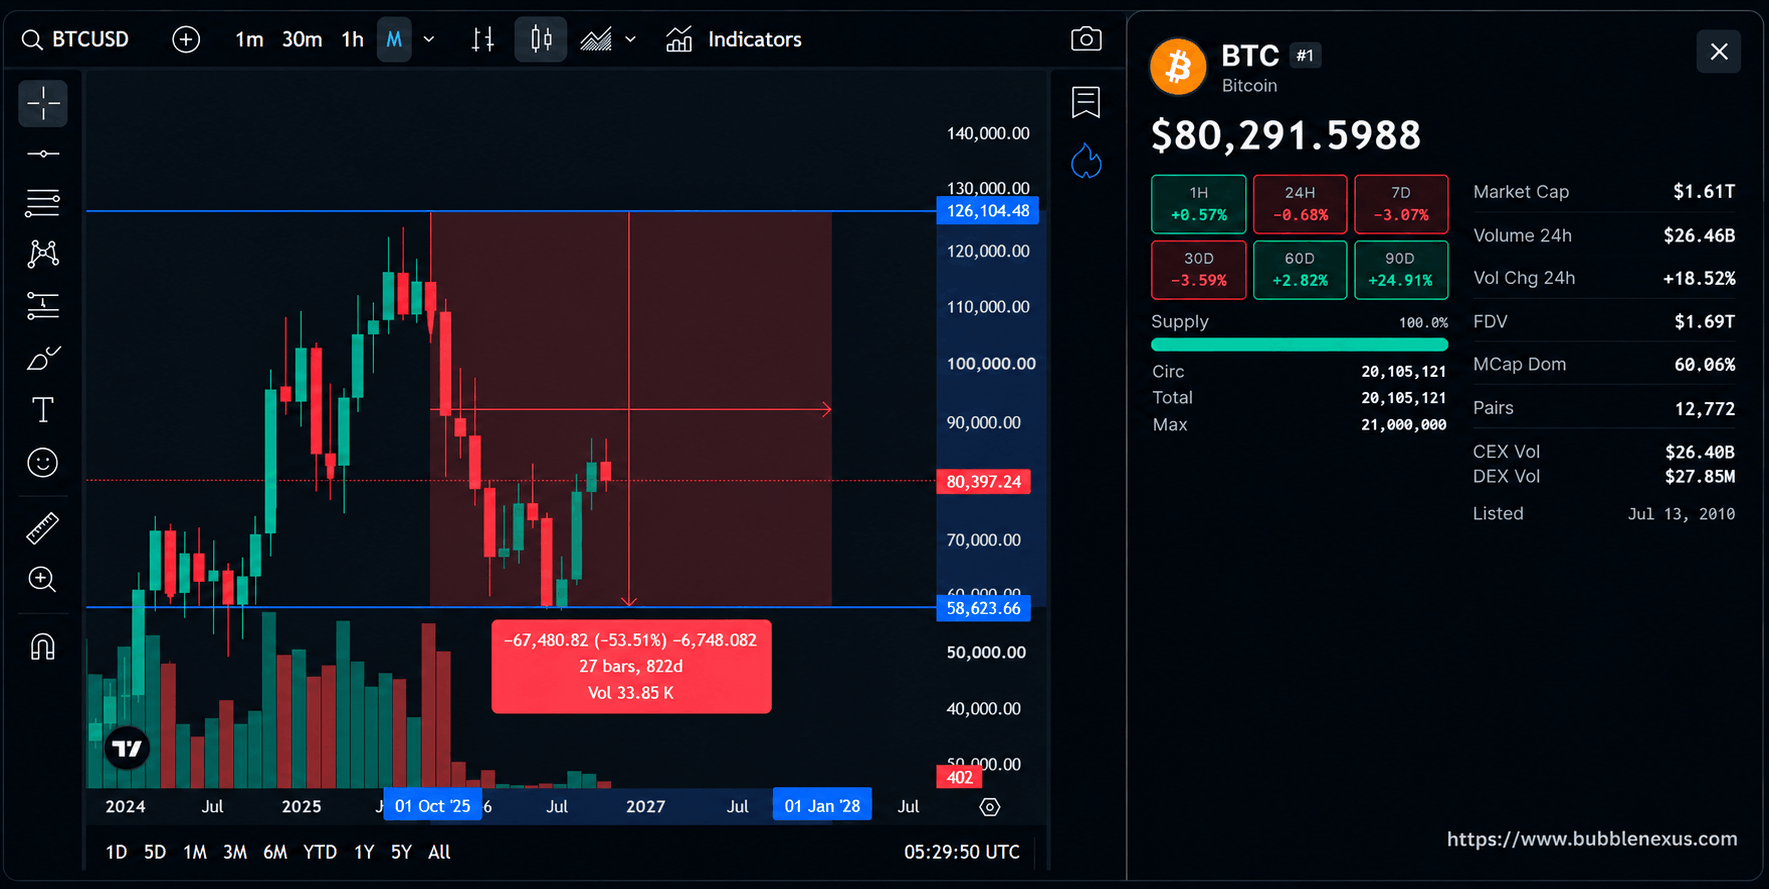
The decline happened as investors faced several pressures at once. U.S. spot Bitcoin ETFs recorded a long run of outflows, leveraged positions were liquidated, market expectations for interest rates shifted, and traders questioned how much demand would come from corporate Bitcoin buyers. Those events may have reinforced one another, but the available evidence does not prove that one event caused the entire fall.
Why did Bitcoin fall? Five pressures behind the decline
1. Liquidations made the sell-off sharper
Some crypto traders borrow funds to take larger positions. If prices move against them, exchanges can close those positions automatically. These liquidations add buy or sell orders to the market and can speed up a move.
CoinGlass reported about $1.83 billion in crypto liquidations on June 5, 2026, one of the largest daily totals in its first-half report. A separate report gave a lower rolling 24-hour figure. The figures use different time windows, so the safest summary is that roughly $1.8 billion in positions were liquidated in a single day. The widely repeated claim that more than 270,000 traders were affected was not confirmed in CoinGlass's published report.
2. Bitcoin ETF outflows reduced one source of demand
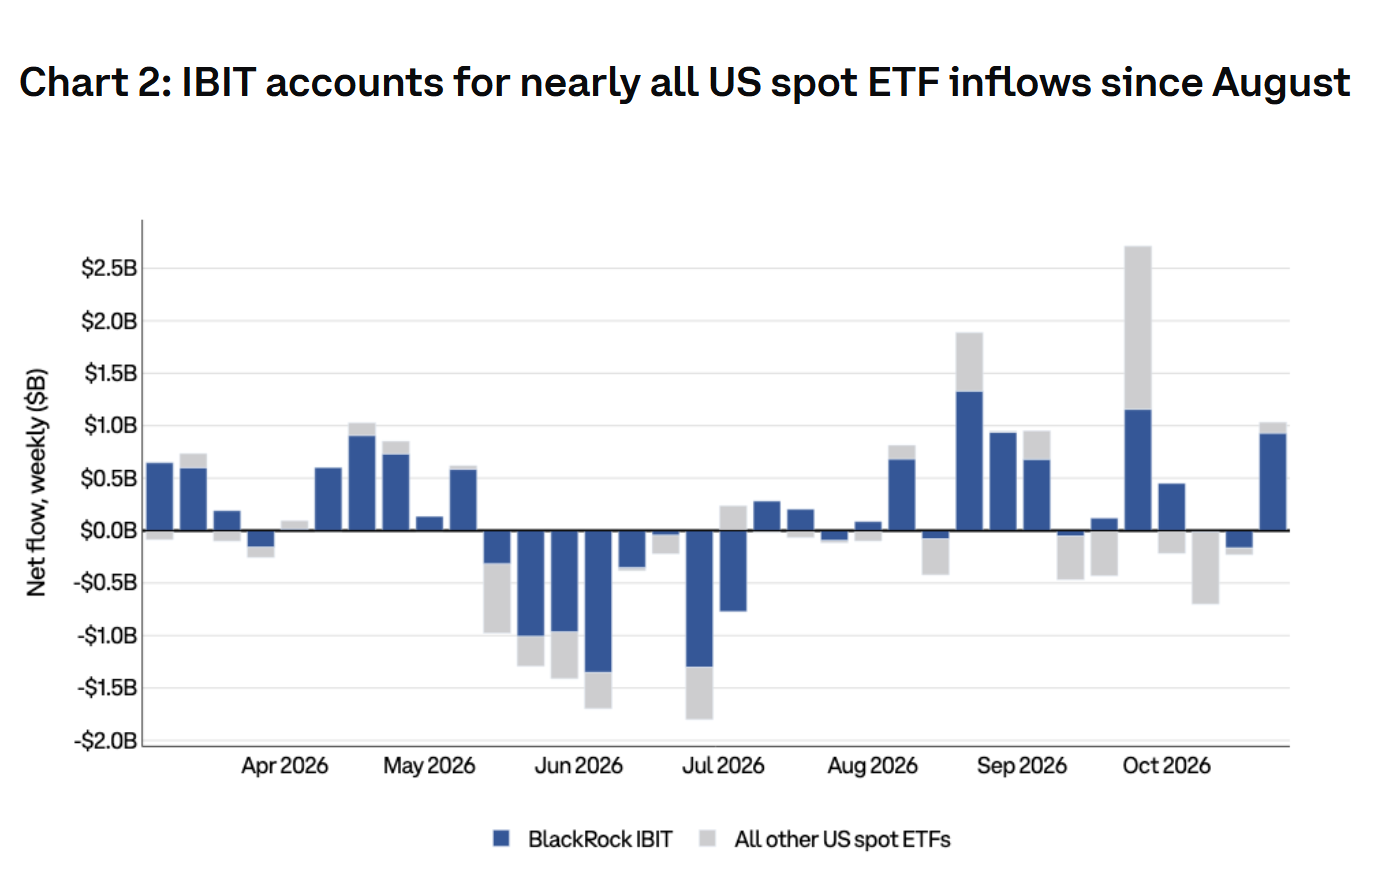
U.S. spot Bitcoin exchange-traded funds let investors gain exposure to Bitcoin through a fund. Farside Investors' flow table shows 13 consecutive trading days of net outflows from May 15 through June 3, totaling about $4.36 billion. ETF flows are one part of the market. They do not show every Bitcoin trade, and a run of outflows does not by itself explain a price decline. Still, it gives readers a measurable sign that some fund investors were reducing exposure during that period.
3. Interest-rate and geopolitical risks weighed on sentiment
Bitcoin does not pay interest. When investors expect higher rates or yields on other assets, they may become less willing to hold risky assets such as cryptocurrencies.
Federal Reserve meeting minutes from June describe rising market rate expectations and higher Treasury yields during that period. The minutes discuss several possible influences, including economic data, inflation, the Middle East conflict and investment in artificial intelligence. They do not identify one factor as the sole cause of Bitcoin's decline.
The original draft placed a U.S.-Iran military exchange on June 2. That date is inaccurate: reporting on June 2 concerned proposed terms to halt the war. The U.S.-Israeli strikes that began the conflict were dated February 28, according to the Congressional Research Service. A safer account is that conflict and risks to oil shipping formed part of the broader market backdrop, while investors also responded to rates and other news.
4. Corporate Bitcoin buying changed over the year
Corporate treasury purchases had been an important source of Bitcoin demand. Coinbase Institutional's October 23 review said that companies bought about $14.5 billion of Bitcoin in the first half of 2026 while U.S. spot ETFs were net sellers of nearly $5 billion. Since August, it estimated that ETFs took in about $6.4 billion, compared with around $1.5 billion of corporate treasury purchases. These figures are Coinbase's research estimates, not a complete record of every buyer.
Strategy disclosed that it sold 32 BTC during May 26 to 31 and announced the sale on June 1. Galaxy described it as the first disclosed sale since 2022. The reported sale was small relative to the company's holdings, so it should not be presented as the cause of the market-wide crash.
5. Leverage, liquidity and market expectations can reinforce each other
When buyers pull back, fewer orders may be available to absorb selling. That can make price moves larger, particularly when leveraged traders are forced to close positions. This is a plausible market mechanism, not proof that any single metric caused Bitcoin's move.
Coinbase Institutional also reported that stablecoin supply, which it uses as a proxy for crypto-native liquidity, was about $12.7 billion below its May peak in its October 23 review. It said the Coinbase Premium, a comparison between Coinbase's BTC-USD price and Binance's BTC-USDT price, had been negative each day that month. The premium is one market signal. It is not a direct count of U.S. buyers.
| Pressure | What the data shows | Source | Limitation |
|---|---|---|---|
| Liquidations | About $1.83 billion liquidated on June 5, 2026 | CoinGlass | Time windows differ between reports |
| ETF outflows | 13 straight trading days of net outflows (May 15 to June 3), about $4.36 billion | Farside Investors | Flows are only one part of the market |
| Rates and geopolitics | Rising rate expectations and higher Treasury yields in June | Federal Reserve minutes | Minutes name no single cause |
| Corporate buying | About $14.5 billion bought in H1 2026, while ETFs were net sellers of nearly $5 billion | Coinbase Institutional | Research estimate, not a full record |
| Liquidity and leverage | Stablecoin supply about $12.7 billion below its May peak | Coinbase Institutional | A proxy, not a direct measure of buyers |
What are traders and analysts saying now?
Different sources read the same market differently. Their comments are views, not guarantees.
| Source | Date | View | Key detail |
|---|---|---|---|
| Galaxy Digital | October 22 | Bullish | Believes the bear market ended in June; about 87,000 BTC added by U.S. spot ETFs since the low |
| Coinbase Institutional | October 23 | Mixed | Support at $80,000 to $82,000, then $73,000 to $75,000; overhead supply at $87,500 to $91,700 |
| Glassnode | October 27 | Cautious | Hyperliquid whale cohort net short for the first time since March |
| Michael Saylor (Strategy) | October 13 | Bullish | Expects Bitcoin to move back above $100,000 |
- Galaxy Digital is bullish. In research sent to clients on October 22, Galaxy said it believes the bear market ended in June and described Bitcoin as being in an accumulation phase. It pointed to five straight weekly closes above the 50-week moving average through October 18 and estimated that U.S. spot ETFs had added about 87,000 BTC since the June low. Galaxy's research is an investment view from a firm with Bitcoin exposure, so readers should weigh that interest when assessing its conclusion.
- Coinbase Institutional sees both support and downside risk. Its October 23 commentary described $80,000 to $82,000 as near-term support and $73,000 to $75,000 as a possible next support area if the first range failed. Those are the firm's technical levels, not guaranteed price floors. It also cited about 2.1 million BTC last moved in the $87,500 to $91,700 range, which it viewed as overhead supply. The underlying measure tracks where coins last moved; it cannot prove that all those holders will sell.
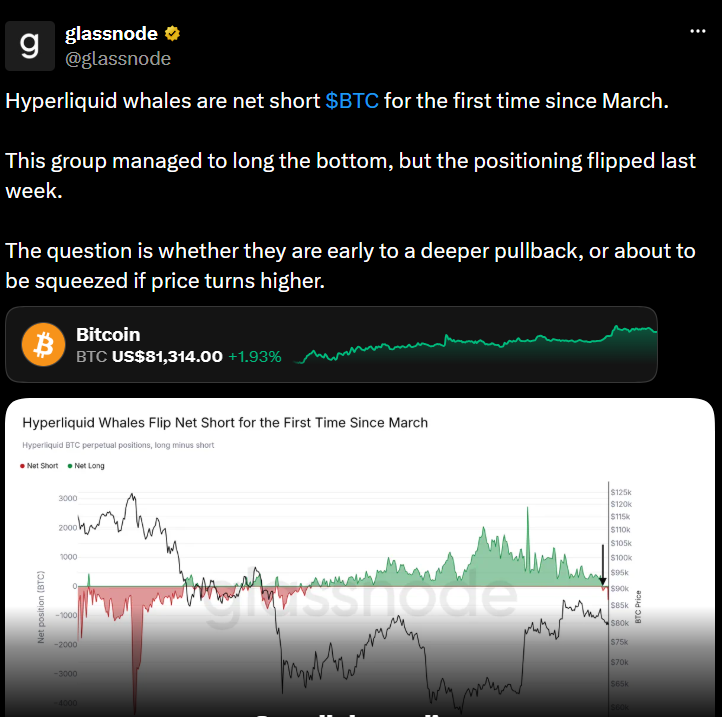
- Some Hyperliquid whale positions turned net short. Glassnode posted on October 27 that its Hyperliquid whale BTC cohort had shifted from net long to net short for the first time since March. This describes the group's aggregate position. It does not show that every large trader opened a short or reveal the amount in that post.
- Strategy's Michael Saylor expects a rebound. In an October 13 Bloomberg interview, Saylor said he thought Bitcoin would move back above $100,000. That is his outlook, not a verified price target or a guarantee.
These indicators do not point in one direction. ETF buying and a technical rebound support the bullish view; weak spot demand, macro uncertainty and price levels that analysts identify as possible support or resistance keep downside risk in the discussion.
Could Bitcoin recover? What past cycles show
Bitcoin recovered above its previous peak after earlier major market declines, but it took time. A Yahoo Finance review measured the time from each prior peak until Bitcoin first closed above that peak again: about 39 months for the 2013 cycle, 36 months for 2017 and 28 months for 2021. These are historical observations, not a timetable for the current market.
| Cycle | Time to recover prior peak |
|---|---|
| 2013 cycle | About 39 months |
| 2017 cycle | About 36 months |
| 2021 cycle | About 28 months |
| 2025-2026 cycle | Still unfolding; outcome unknown |
The 2025-2026 cycle is still unfolding as of this article's date. Its final low, recovery time and next high are unknown. Past recoveries do not guarantee another one.
Three ways to think about the outlook
These are scenarios to help explain what could move the market. They are not predictions.
- A gradual recovery: ETF inflows continue, demand improves and Bitcoin holds above levels that market analysts are watching.
- A long period of sideways trading: buyers and sellers remain balanced while markets wait for clearer information about rates, inflation and demand.
- A further decline: outflows return, macro conditions worsen or traders lose confidence in the support zones they are watching.
What should Bitcoin investors watch next?
As of the article's October 28 review, the Federal Reserve's October 27-28 meeting was still in progress. The October 28 decision had not yet been announced. The Bureau of Economic Analysis had scheduled its third-quarter GDP advance estimate and September Personal Income and Outlays report for October 29 at 8:30 a.m. Eastern Time. Those figures were still upcoming, so this article does not describe their results.
Readers can also follow ETF flow reports, changes in spot demand, and whether Bitcoin holds or loses the trend levels analysts have identified. These signals can change quickly and should not be treated as stand-alone trading instructions.
Frequently asked questions
Why did Bitcoin crash in 2026?
Several pressures overlapped: ETF outflows, forced liquidations, changing interest-rate expectations, geopolitical concerns and questions about corporate buying. The evidence supports a combination of factors, not one proven cause.
What was Bitcoin's lowest price in 2026?
Prices differ by exchange and data provider. CoinMarketCap's daily historical table shows a low near $57,748 on July 1, 2026, and a June 25 low near $58,076. Other sources report slightly different intraday lows.
Will Bitcoin recover?
No one can know. Bitcoin has recovered above earlier peaks after previous bear markets, but those recoveries took years. The 2025-2026 cycle is not complete, and prior performance does not guarantee future results.