




Summary:
- Record Total Net Revenues: Reached $1.3 billion, marking a 32% year-over-year increase.
- Strong EPS Growth: Diluted EPS was $0.62, a 66% sequential increase and 48% year-over-year.
- Significant Net Deposits: Record $22 billion in Q2, with a 28% annualized growth rate.
- Funded Customers Expansion: Grew by 1.9 million year-over-year, reaching 28.4 million.
- Robinhood Gold Subscribers Surge: Increased by 1.4 million year-over-year to 4.84 million.
- Adjusted EBITDA Growth: Rose 35% year-over-year to $741 million.
What Are the Key Highlights of Robinhood's Q2 2026 Earnings?
Robinhood Markets, Inc. reported a robust second quarter for 2026, demonstrating significant growth across key financial and operational metrics. The company achieved record total net revenues and substantial increases in earnings per share, driven by strong performance in trading volumes and subscriber growth.
Total Net Revenues
Total net revenues for Q2 2026 reached a record $1.3 billion, representing a 32% increase year-over-year and a 23% sequential increase. This growth was primarily fueled by strong transaction-based revenues and net interest revenues.
Earnings Per Share (EPS)
Diluted Earnings Per Share (EPS) for Q2 2026 stood at $0.62. This marks a significant 66% sequential increase and a 48% year-over-year growth, indicating improved profitability and operational efficiency.
Adjusted EBITDA
Adjusted EBITDA increased by 35% year-over-year to $741 million in Q2 2026. The last twelve months' Adjusted EBITDA reached a record $2.8 billion, with a 56% margin, underscoring the company's strong operational leverage.
What was Robinhood's Key Business Highlights in Q2 2026?
The second quarter of 2026 also saw impressive growth in Robinhood's user base and platform assets, reflecting successful customer acquisition and engagement strategies.
Funded Customers
The number of Funded Customers reached 28.4 million in Q2 2026, an increase of 1.9 million year-over-year and 940k sequentially. This growth includes approximately 300k Funded Customers from the acquisition of WonderFi.
Robinhood Gold Subscribers
Robinhood Gold Subscribers grew to 4.84 million, up 1.4 million year-over-year and 500k sequentially. The Robinhood Gold Adoption Rate also increased to 17.0%.
Total Platform Assets
Total Platform Assets increased by 32% year-over-year and 20% sequentially, reaching $369 billion. This growth reflects increased customer deposits and asset appreciation.
Net Deposits
Net Deposits were a record $22 billion in Q2, translating to a 28% annualized growth rate. Over the last twelve months, Net Deposits totaled $76 billion, representing a 27% growth rate.
How Much Trading Volume has Robinhood Reported in Q2 2026?
Q2 trading volumes showed significant year-over-year increases, with Equities and Options reaching new quarterly records.
- Equity Notional Volumes: Up 85% year-over-year and 50% quarter-over-quarter.
- Options Contracts Traded: Up 50% year-over-year and 32% quarter-over-quarter.
- Crypto Notional Volumes: Up 15% year-over-year, though down 39% quarter-over-quarter.
What are Robinhood's Q2 2026 Revenue and EPS Results?
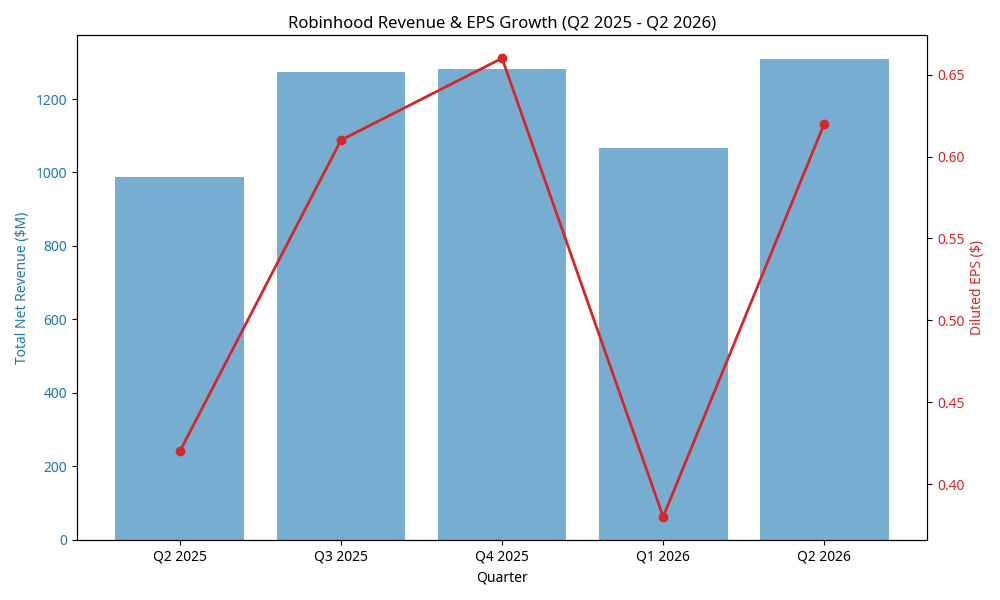
The following chart illustrates the trend of Robinhood's Total Net Revenue and Diluted EPS over the past five quarters, highlighting the growth trajectory.
What Are Robinhood's Key Financial Metrics for Q2 2026?
Here's a quick-reference table summarizing Robinhood's key financial metrics for Q2 2026 compared to previous quarters:
| Metric | Q2 2025 | Q3 2025 | Q4 2025 | Q1 2026 | Q2 2026 |
|---|---|---|---|---|---|
| Total Net Revenues ($M) | 989 | 1,274 | 1,283 | 1,067 | 1,308 |
| Diluted EPS ($) | 0.42 | 0.61 | 0.66 | 0.38 | 0.62 |
| Adjusted EBITDA ($M) | 549 | 742 | 761 | 534 | 741 |
| Funded Customers (M) | 26.5 | 26.8 | 27.0 | 27.4 | 28.4 |
| Robinhood Gold Subscribers (M) | 3.48 | 3.88 | 4.18 | 4.34 | 4.84 |
Frequently Asked Questions (FAQs)
Q1: What were Robinhood's total net revenues in Q2 2026?
A: Robinhood reported record total net revenues of $1.3 billion in Q2 2026.
Q: What was the growth in Funded Customers?
A: Funded Customers grew by 1.9 million year-over-year, reaching 28.4 million.
Q: What is the significance of the Adjusted EBITDA growth?
A: The 35% year-over-year increase in Adjusted EBITDA to $741 million indicates strong operational efficiency and profitability.
Disclaimer: This content is for informational purposes only and is not financial or investment advice.