


As of June 24, 2026
Key Revenue Trends in 2026
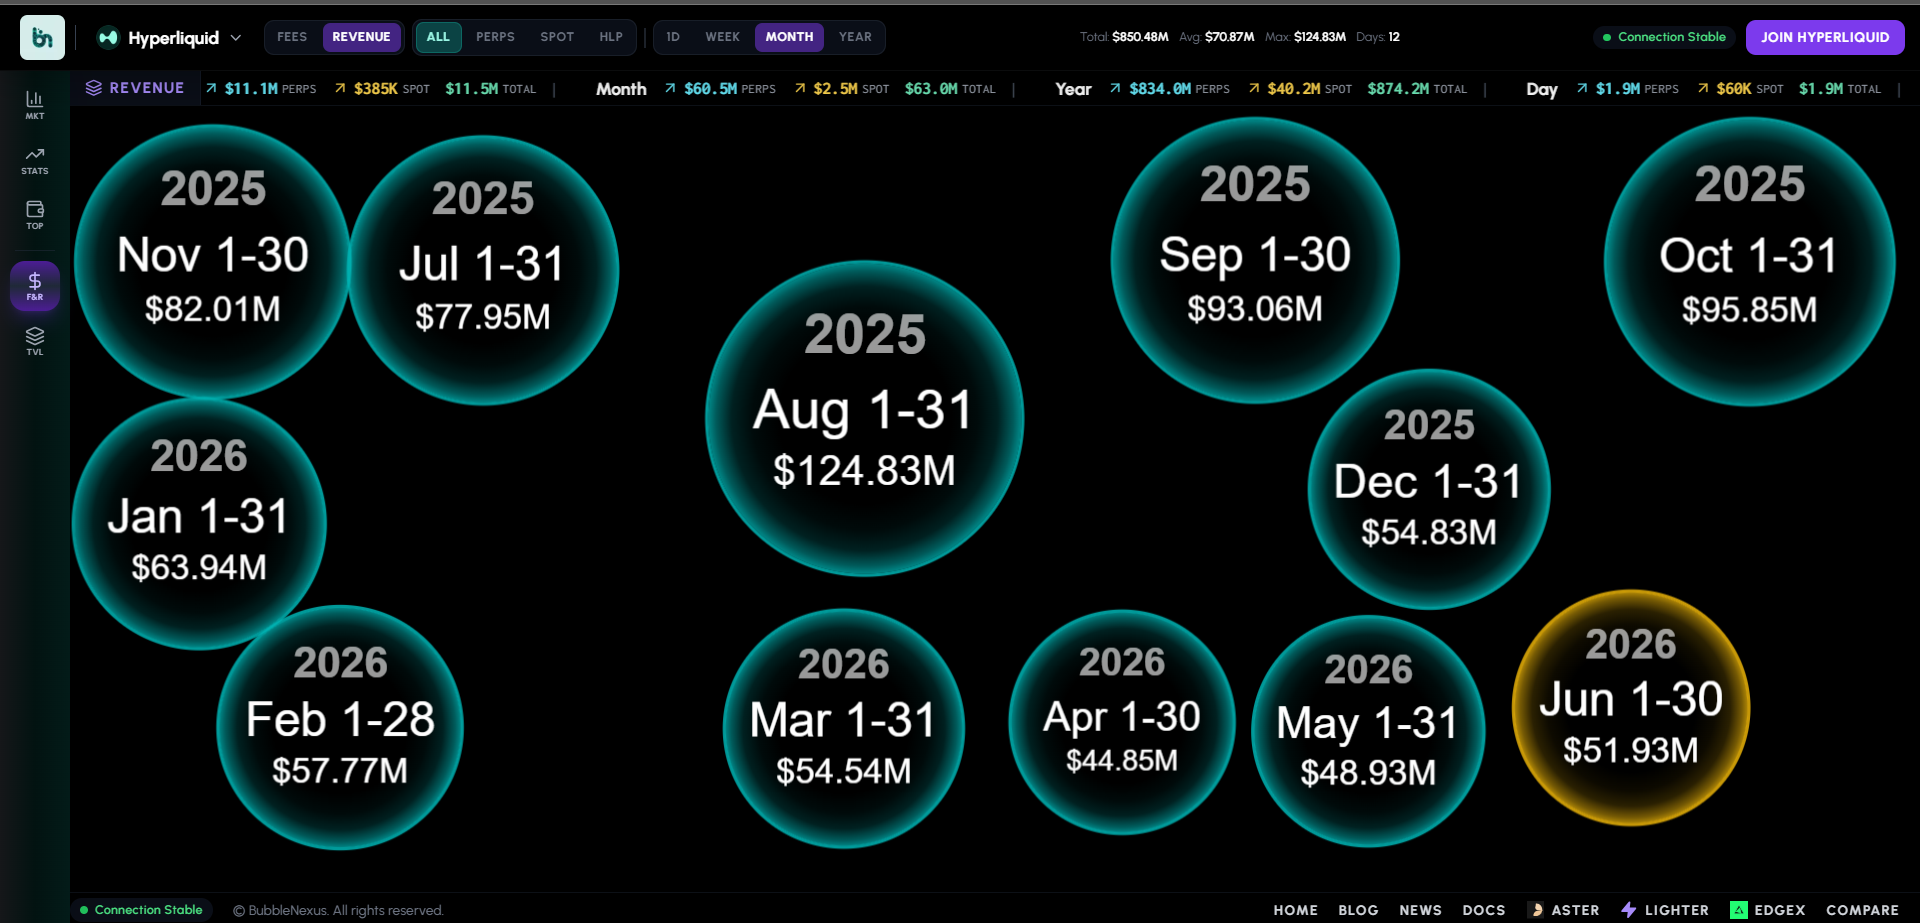
- January 2026 set the benchmark for Hyperliquid's revenue performance, generating approximately $63.94 million in monthly revenue. Strong perpetual futures activity and elevated trading volumes helped make it the highest-revenue month of the year so far.
- Following January's peak, monthly revenue gradually declined throughout the following months as trading activity normalized from its record-breaking levels. Despite the pullback, Hyperliquid continued to generate substantial protocol revenue and remained one of the top-performing DeFi protocols.
- Even with the month-over-month decline, the protocol maintained healthy fee generation, Q1 (Quarter 1) 2026 gross revenue reached approximately $218.29 million, one of the strongest quarterly performances ever recorded in decentralized finance.
- Revenue momentum began improving again during the second quarter, with market activity strengthening in May and carrying into June. Increased trading participation and higher derivatives volume helped support this recovery.
- As of late June 2026, Hyperliquid's revenue trajectory appears significantly stronger than in previous months, putting the platform within reach of January's record-setting performance. While final monthly figures are not yet available, June is shaping up to be one of the highest-revenue months of the year.
- The key question for traders and investors is whether June can surpass January's $63.94 million revenue milestone. With only final end-of-month results remaining, market participants are closely watching whether Hyperliquid can establish a new revenue peak for 2026.
June's Key Metrics Reveal About Hyperliquid's Growth
Trading Activity
June continues to post impressive market activity with $9.4B in 24-hour perpetual volume, showing sustained trader participation.
Fee Generation
Recent data shows $2.2M in daily perpetual fees, demonstrating Hyperliquid's ability to convert trading activity into revenue.
HYPE Milestone
The HYPE token reached a new all-time high of $76.7 during June, marking one of the ecosystem's biggest achievements in 2026.
Hyperliquid continues to solidify its position as the leading decentralized perpetuals exchange. With consistently high trading volumes and robust fee generation, the protocol has delivered strong performance throughout the first half of 2026. The recent HYPE token all-time high reflects growing market confidence in the ecosystem’s long-term potential. These metrics highlight Hyperliquid’s ability to maintain momentum even in fluctuating market conditions, backed by its innovative on-chain infrastructure and expanding builder ecosystem.
Conclusion
While January 2026 established a formidable benchmark for Hyperliquid's revenue performance, June demonstrates a sustained period of robust activity and growth. The platform's consistent trading volumes, high open interest, and the HYPE token's all-time high underscore its strong market position. Although direct comparisons for monthly revenue can be complex due to data availability and reporting cycles, the overall trajectory for Hyperliquid in the first half of 2026 remains exceptionally strong. The innovative features and strategic expansions implemented by Hyperliquid continue to drive its success, making it a key player to watch in the evolving decentralized finance landscape.
Frequently Asked Questions (FAQs)
1. What drives Hyperliquid's revenue?
Hyperliquid primarily generates revenue from perpetual futures trading fees, spot trading fees, and builder code fees. Perpetual trading activity remains the largest contributor to protocol income.
2. Why is Hyperliquid considered one of the leading DeFi protocols?
Hyperliquid has become a major player in decentralized finance due to its high trading volumes, deep liquidity, efficient trading infrastructure, and consistent revenue generation. These factors have helped it compete with some of the largest protocols in the industry.
3. How can investors track Hyperliquid's revenue and trading activity?
Investors can monitor Hyperliquid's performance through official platform analytics, revenue dashboards, trading volume statistics, and third-party data providers such as DefiLlama, Artemis, CoinGecko, and Token Terminal.