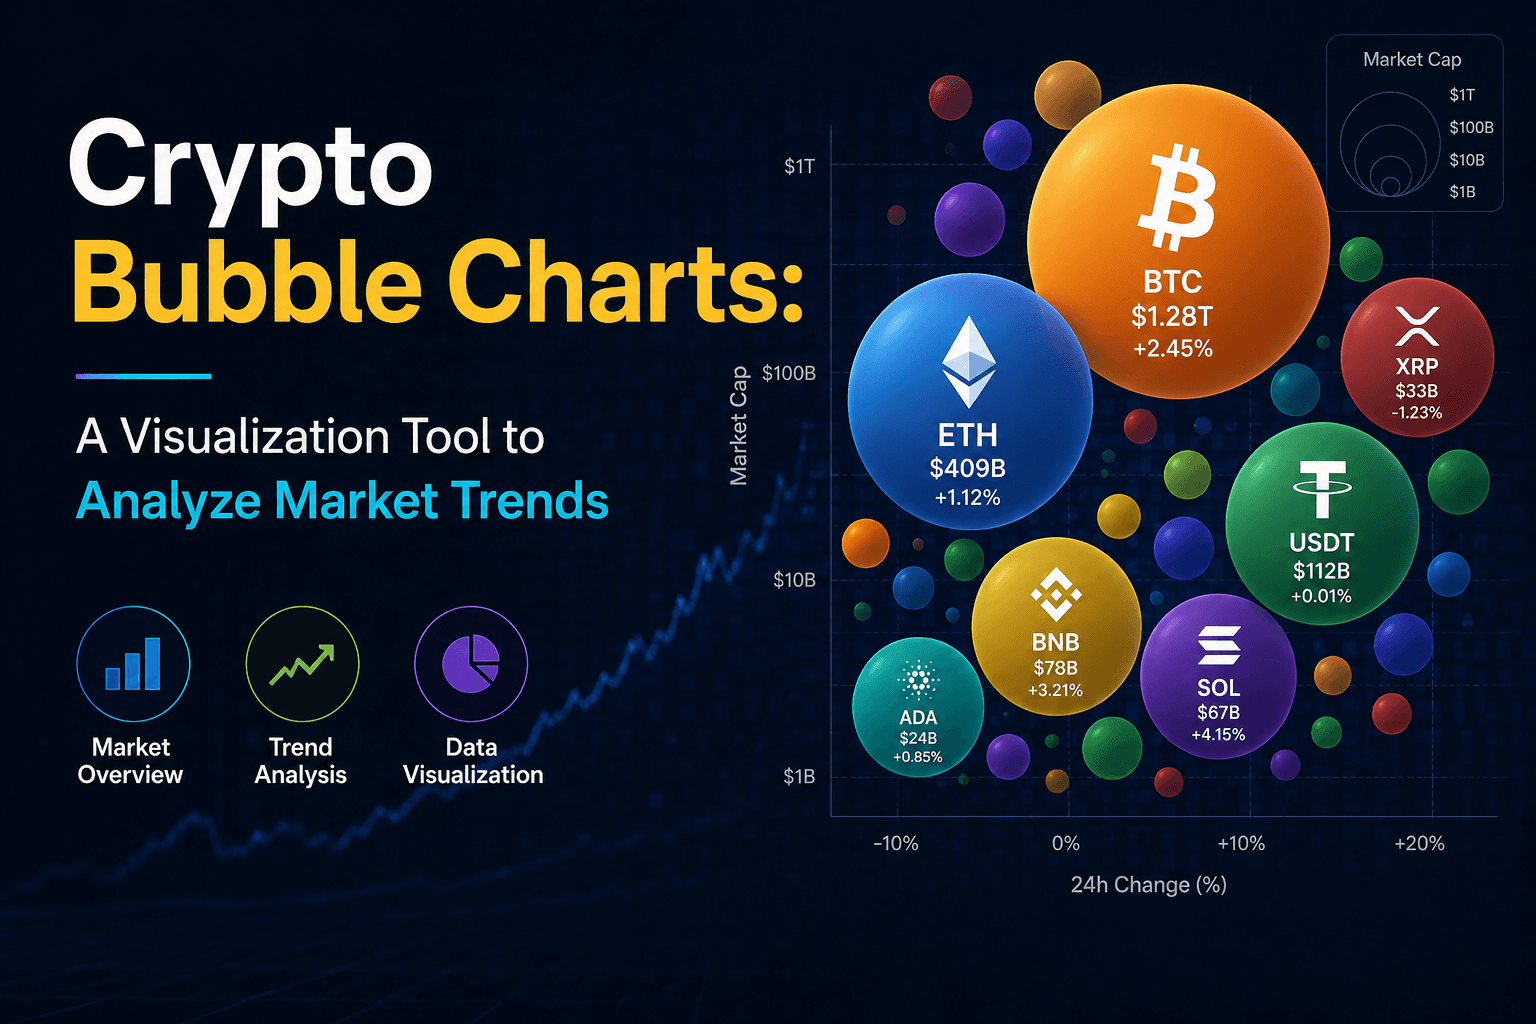




A crypto bubble chart provides a real-time visual representation of cryptocurrencies based on performance, market capitalization, and price movement. Each coin is displayed as a “bubble,” making it easier to identify strong performers, weak assets, and overall market trends at a glance. It is widely used by traders to track momentum, compare cryptocurrencies, and make faster data-driven decisions.
Table of Contents
1. What Is a Crypto Bubble Chart?2. How a Crypto Bubble Chart Works
3. Comparison Table of Popular Crypto Bubble Charts
4. Key Metrics Behind Bubble Charts
5. How Traders Use Bubble Charts
6. Benefits of Crypto Bubble Charts
7. Limitations You Should Know
8. Final Verdict
Frequently Asked Questions (FAQ)
1. What Is a Crypto Bubble Chart?
A crypto bubble chart is a visual market analysis tool that represents cryptocurrencies as bubbles based on performance metrics such as price change, market cap, and trading volume.
Each bubble’s size and color represent different data points, allowing users to instantly understand which assets are performing well and which are underperforming in real time.
- Visual representation of crypto market performance
- Real-time tracking of price movements
- Simplified market comparison tool
2. How Crypto Bubble Chart Works

Crypto bubble charts collect live market data from exchanges and analytics platforms. This data is transformed into dynamic visual bubbles that update continuously based on market activity, helping traders identify trends, volatility, and capital movement faster than traditional chart layouts.
For example, strong gainers often appear as larger green bubbles, while declining assets may shrink or turn red depending on price performance and platform design. Many advanced platforms also apply real-time scaling algorithms to maintain visual balance across thousands of cryptocurrencies.
- Price Change Determines Color Intensity: Higher positive returns typically appear in brighter green shades, while stronger losses appear in deeper red tones.
- Market Capitalization Affects Bubble Size: Large-cap assets like Bitcoin and Ethereum usually dominate the visual space due to their higher valuation and liquidity.
- Trading Volume Influences Market Activity Signals: Assets with rising volume often gain more visibility, helping traders detect unusual market participation or breakout momentum.
- Real-Time Data Aggregation: Most bubble chart systems pull live data from multiple exchanges and APIs to maintain updated market visualization across thousands of assets.
- Volatility Mapping: Rapid bubble expansion or contraction can indicate increasing volatility, allowing traders to quickly identify high-risk or high-momentum assets.
- Sector and Category Clustering: Advanced bubble charts group assets by sectors such as AI tokens, DeFi, Layer-1, or meme coins, making trend rotations easier to identify.
- Timeframe-Based Filtering: Users can switch between 1-hour, 24-hour, 7-day, or custom views to analyze short-term momentum or long-term trend behavior.
3. Comparison Table of Popular Crypto Bubble Charts
Understanding the difference between these three visualization tools can help traders choose the right strategy for analyzing the crypto market.
| Feature | Crypto Bubble Charts | Crypto Heatmaps | Candlestick Charts |
|---|---|---|---|
| Main Purpose | Visualize market trends and sector movement | Show overall market performance | Analyze price action over time |
| Best For | Spotting momentum and volatility | Quick market overview | Technical analysis and trading |
| Data Display | Bubble size, color, and position | Color-coded asset performance | Open, high, low, close prices |
| Time Analysis | Medium-term trend analysis | Instant market sentiment | Short-term and long-term analysis |
| Complexity | Beginner-friendly | Very easy | Advanced |
| Ideal Users | Traders and analysts | Casual investors | Active traders |
4. Key Metrics behind Crypto Bubble Charts

Bubble charts rely on multiple real-time metrics to generate accurate visual insights for traders and analysts.
- Price Change: Shows market momentum
- Market Capitalization: Indicates asset size
- Trading Volume: Measures liquidity strength
- Time Frame: 24h, 7d, or custom analysis
-
Integration with Technical Indicators:
- Bubble charts can be cross-validated with RSI, MACD, and moving averages.
- Helps confirm whether “overbought bubbles” align with RSI > 70 conditions.
-
Liquidity and Market Microstructure:
- Order book depth and trading liquidity directly affect bubble size accuracy.
- Low-cap coins may show exaggerated movements due to thin liquidity.
-
Volatility Normalization:
- Raw price change alone is not reliable for comparison across assets.
- Normalization using market cap and volume improves fairness of analysis.
-
Cross-Timeframe Validation:
- Short-term signals must be compared with long-term trends.
- Prevents misleading conclusions from temporary spikes.
-
Data Reliability Factors:
- Exchange differences (e.g., Binance vs smaller exchanges) can distort signals.
- Latency and incomplete data feeds may affect real-time accuracy.
5. How Traders Use Bubble Charts
Traders use crypto bubble charts as a fast visual intelligence tool to decode market behavior in seconds. Instead of manually scanning hundreds of candlestick charts, they can instantly identify momentum shifts, capital flows, and overextended assets in a single view.
- Spot Market Leaders and Laggards Instantly: For example, during the 2021 bull run, assets like Solana (SOL) and Avalanche (AVAX) frequently appeared as strong green bubbles, signaling consistent outperformance compared to slower-moving large caps like Bitcoin.
- Detect Early Trend Rotations: In many market cycles, traders observed capital rotation from Bitcoin and Ethereum into mid-cap altcoins such as Chainlink (LINK) and Polygon (MATIC), which bubble charts often highlight as expanding or accelerating bubbles.
- Multi-Asset Comparison in Real Time: During volatile sessions, especially around major events like Fed announcements or ETF news, traders use bubble charts to quickly compare hundreds of assets instead of switching between individual charts.
- Momentum and Sentiment Tracking: For instance, during meme coin surges like Dogecoin (DOGE) and Shiba Inu (SHIB), bubble charts often show extreme expansion phases, reflecting strong retail-driven sentiment spikes.
- Risk Identification and Capital Protection: At market tops (such as early 2021 or late 2024 rallies), many low-cap coins appear excessively inflated in bubble charts, helping traders identify overheating zones before corrections occur.
- Short-Term Opportunity Scanning: Traders often use bubble charts during intraday volatility to spot breakout candidates like PEPE or BONK during their early momentum phases before they appear on traditional technical screeners.
Overall, bubble charts act as a decision acceleration tool, helping traders filter noise, focus on high-impact market movements, and react faster in highly volatile crypto environments.
6. Benefits of Crypto Bubble Charts
Crypto bubble charts simplify large amounts of market data into a visual format that traders can interpret within seconds. In highly volatile crypto markets where prices may change rapidly, this visual efficiency helps traders react faster than relying only on traditional candlestick analysis .
For example, during major market rallies such as the 2021 altcoin season, traders used bubble visualization tools to quickly identify accelerating sectors like DeFi, Layer-1 ecosystems, and meme coins before many assets reached peak momentum.
- Fast Market Overview: Bubble charts can display hundreds or even thousands of cryptocurrencies simultaneously, reducing market scanning time significantly compared to manual chart-by-chart analysis.
- Improved Decision-Making: Traders can instantly identify outperforming assets, unusual volume spikes, and sector-wide momentum shifts without processing raw numerical datasets.
- Real-Time Data Visualization: Most platforms update continuously using live exchange feeds, helping traders monitor sudden volatility events, liquidation cascades, or breakout movements as they happen.
- Enhanced Pattern Recognition: Large expanding green bubbles often indicate aggressive bullish momentum, while rapidly shrinking or dark-red clusters may signal panic selling or weakening market sentiment.
- Sector Rotation Analysis: Professional traders use bubble charts to observe capital movement between sectors such as AI tokens, gaming, DeFi, and meme coins, helping identify emerging narratives early.
- Risk Identification: Overextended bubbles with extreme short-term growth may help traders detect overheating conditions before sharp corrections or profit-taking phases occur.
- Accessibility for All Experience Levels: Beginners benefit from intuitive visual interpretation, while advanced traders combine bubble charts with technical indicators, order-flow analysis, and market structure confirmation.
Market Analysis Visualization
Market Scanning Efficiency
Capital Rotation Example During Bull Markets
Momentum Detection Accuracy
7. Limitations of Crypto Bubble Chart
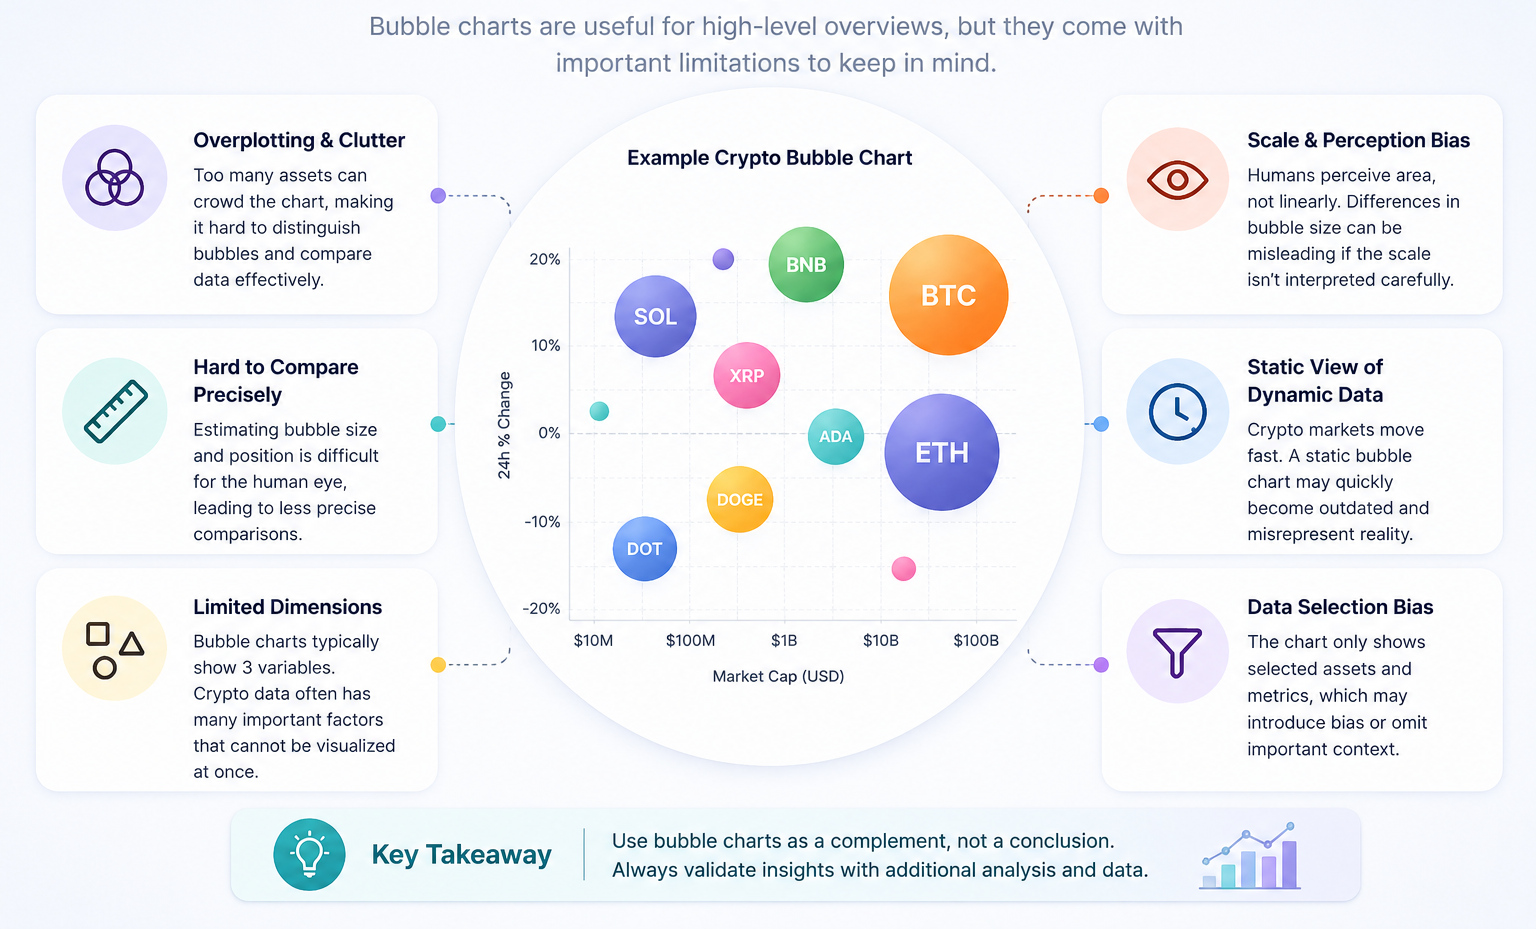
While crypto bubble charts are useful for visualizing market trends, they come with several important limitations that traders and analysts should understand before relying on them for decision-making.
-
1. Oversimplification of Complex Markets:
Bubble charts reduce multi-dimensional market data (price, volume, momentum, sentiment) into a simplified visual format. This can hide deeper structural factors such as liquidity depth, order book pressure, and macroeconomic influences. -
2. Short-Term Signal Bias:
Most bubble chart models are heavily influenced by short-term price movements. This makes them more reactive to recent volatility rather than long-term fundamental value, which may lead to misleading interpretations during sudden market spikes or corrections. -
3. Lack of Fundamental Analysis Integration:
These charts primarily focus on technical indicators and price behavior, ignoring fundamental factors like project utility, adoption rate, tokenomics, or developer activity, which are critical for long-term investment decisions. -
4. Misleading During Low Liquidity Conditions:
In low-cap or illiquid cryptocurrencies, small trades can create exaggerated visual effects on bubble size and movement. This can distort the actual market strength of an asset. -
5. Susceptibility to Market Manipulation:
Pump-and-dump schemes or coordinated trading activities can temporarily inflate metrics like volume or price, making a weak asset appear strong on the bubble chart. -
6. No Predictive Guarantee:
Bubble charts are descriptive, not predictive. They show what is happening in the market but do not guarantee future price direction or trend reversals. -
7. Dependence on Data Quality:
The accuracy of the chart depends entirely on the underlying data sources and refresh rate. Delayed, incomplete, or inaccurate exchange data can lead to misleading visual outputs.
Overall, while crypto bubble charts are powerful for quick market scanning and visualization, they should always be used alongside technical analysis, fundamental research, and risk management strategies.
8. Final Verdict
Crypto bubble charts are one of the most effective visual tools for understanding market trends quickly. They simplify large amounts of data into an intuitive format that helps traders make faster and more informed decisions.
Platforms like Bubble-based analytics tools (including modern Web3 dashboards) are making crypto data more accessible, transparent, and actionable for everyone.
Frequently Asked Questions (FAQ)
What is a crypto bubble chart used for?
It is used to visualize cryptocurrency performance and identify market trends quickly.
Are bubble charts good for trading decisions?
They are useful for quick insights but should be combined with technical analysis for better decisions.
Do bubble charts show real-time data?
Yes, most modern platforms update bubble charts in real time based on live market data.
Who uses crypto bubble charts?
Both beginner and professional traders use them for quick market overview and trend analysis.